xDebug is great development tool, but is slows down a web site significantly. During development cycle, it is desirable to turn on xDebug only when it is really needed. Let us show how to turn xDebug on, off, and set profiling modes in Laragon development environment. Also, we will show how to add buttons for these actions to phpStorm toolbar.
This is what final result will be (4 rightmost buttons).

First, let us create a command file to switch xDebug. We assume that we work on Windows 10 with Linux Bash Shell installed. In some folder, which is in Windows PATH, let us create two files: xdebug.bat and xdebug.sh.
xdebug.bat:
@echo off
bash xdebug.sh %*
xdebug.sh:
#!/bin/bash
#set -v

ini_file="/mnt/c/laragon/bin/php/php-7.2.10/php.ini"

if [ -z $1 ]
then
	if grep -q '^extension=blackfire' "$ini_file"
	then
		echo 'xdebug is BLACKFIRE'
		exit 0
	fi
	if grep -q '\;zend_extension' "$ini_file"
	then
		echo 'xdebug is OFF'
		exit 0
	fi
	if grep -q 'xdebug.profiler_enable=0' "$ini_file"
	then
		echo 'xdebug is ON'
		exit 0
	else
		echo 'xdebug is PROFILER'
		exit 0
	fi
fi

if [ 'on' = $1 ]
then
	sed -i s/^\;zend_extension=php_xdebug/zend_extension=php_xdebug/g $ini_file
	sed -i s/^xdebug.profiler_enable=1/xdebug.profiler_enable=0/g $ini_file
	sed -i s/^extension=blackfire/\;extension=blackfire/g $ini_file
	pid=$(pgrep blackfire-agent)
	if [ ! -z $pid ]
	then
		kill $pid
	fi
	/mnt/c/laragon/laragon.exe reload apache
	exit 0
fi

if [ 'profiler' = $1 ]
then
	sed -i s/^\;zend_extension=php_xdebug/zend_extension=php_xdebug/g $ini_file
	sed -i s/^xdebug.profiler_enable=0/xdebug.profiler_enable=1/g $ini_file
	sed -i s/^extension=blackfire/\;extension=blackfire/g $ini_file
	pid=$(pgrep blackfire-agent)
	if [ ! -z $pid ]
	then
		kill $pid
	fi
	/mnt/c/laragon/laragon.exe reload apache
	exit 0
fi

if [ 'off' = $1 ]
then
	sed -i s/^zend_extension=php_xdebug/\;zend_extension=php_xdebug/g $ini_file
	sed -i s/^xdebug.profiler_enable=1/xdebug.profiler_enable=0/g $ini_file
	sed -i s/^extension=blackfire/\;extension=blackfire/g $ini_file
	pid=$(pgrep blackfire-agent)
	if [ ! -z $pid ]
	then
		kill $pid
	fi
	/mnt/c/laragon/laragon.exe reload apache
	exit 0
fi

if [ 'blackfire' = $1 ]
then
	sed -i s/^zend_extension=php_xdebug/\;zend_extension=php_xdebug/g $ini_file
	sed -i s/^xdebug.profiler_enable=1/xdebug.profiler_enable=0/g $ini_file
	sed -i s/^\;extension=blackfire/extension=blackfire/g $ini_file
	/mnt/c/laragon/laragon.exe reload apache
	pid=$(pgrep blackfire-agent)
	if [ ! -z $pid ]
	then
		kill $pid
	fi
	exec /mnt/c/Programs/Blackfire/blackfire-agent.exe
	exit 0
fi

echo 'argument can be "on", "off", "profiler" or "blackfire" only'
exit 1
Usage is:
- xdebug (without arguments) – show the current status
- xdebug on – turn on xDebug
- xdebug off – turn off xDebug
- xdebug profiler – turn on xDebug with profiler
- xdebug blackfire – turn on Blackfire profiler (has no relation to xDebug, definitely, but I have decided to include it into the same script)
xdebug.bat calls xdebug.sh to do the following:
- comment/uncomment proper lines in php.ini to switch xDebug
- reloads Apache web server in Laragon
- starts/stops Blackfire profiling agent if needed
php.ini (which location is set in the first line of xdebug.sh) should contain lines like that:
[blackfire]
;extension=blackfire
; On Windows use the following configuration:
; extension=php_blackfire.dll

; Sets the socket where the agent is listening.
; Possible value can be a unix socket or a TCP address.
; Defaults to unix:///var/run/blackfire/agent.sock on Linux,
; unix:///usr/local/var/run/blackfire-agent.sock on MacOSX,
; and to tcp://127.0.0.1:8307 on Windows.
;blackfire.agent_socket = unix:///var/run/blackfire/agent.sock
blackfire.agent_socket = tcp://127.0.0.1:8308

blackfire.agent_timeout = 0.25

; Log verbosity level (4: debug, 3: info, 2: warning, 1: error)
blackfire.log_level = 4

; Log file (STDERR by default)
blackfire.log_file = /tmp/blackfire.log

; Sets fine-grained configuration for Probe.
; This should be left blank in most cases. For most installs,
; the server credentials should only be set in the agent.
blackfire.server_id = your-server-id

; Sets fine-grained configuration for Probe.
; This should be left blank in most cases. For most installs,
; the server credentials should only be set in the agent.
blackfire.server_token = your-token

[Xdebug]
;zend_extension=php_xdebug-2.6.1-7.2-vc15-nts-x86_64.dll

xdebug.remote_enable=1
xdebug.remote_connect_back=On
xdebug.remote_port="9001"
xdebug.profiler_enable=0
xdebug.profiler_output_dir = c:\laragon\tmp
xdebug.profiler_output_name = %R_%t_cachegrind.out
xdebug.show_mem_delta = 0
You can omit [blackfire] section if you don’t need this profiler.
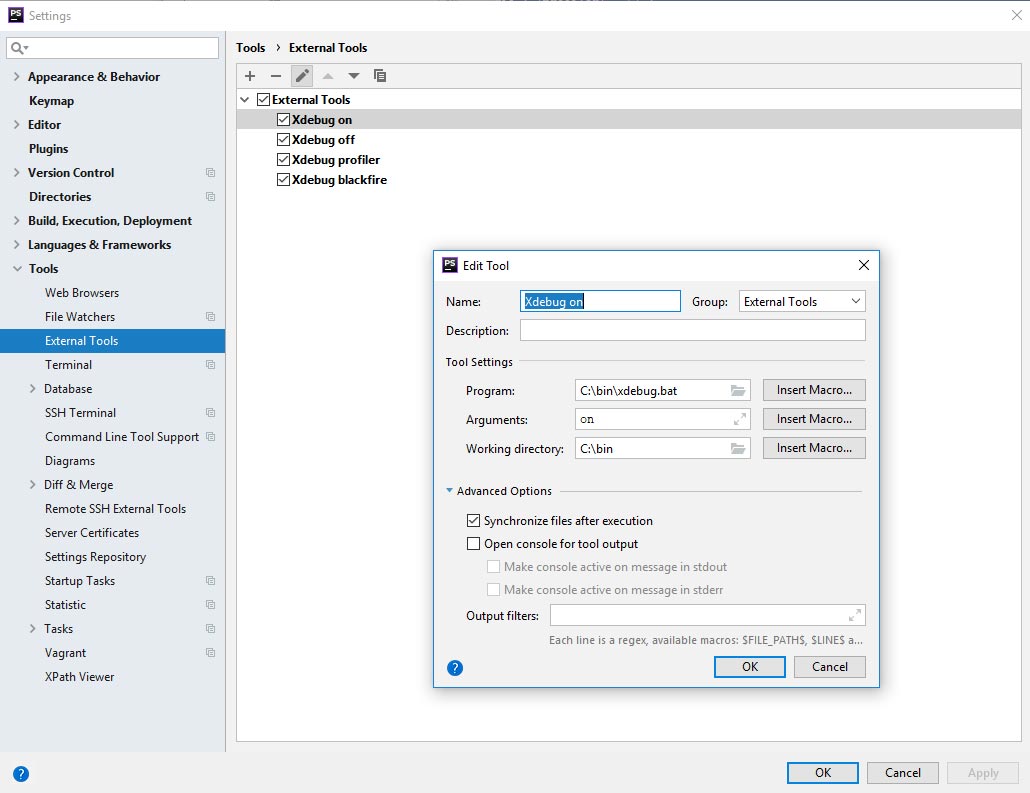
At this moment, we can use xdebug command from PhpStorm terminal. But let us go further. We can add these commands to External Tools in PhpStorm. Open Settings (Ctrl+Alt+S), find Tools > External Tools, and add several tools, as shown below:

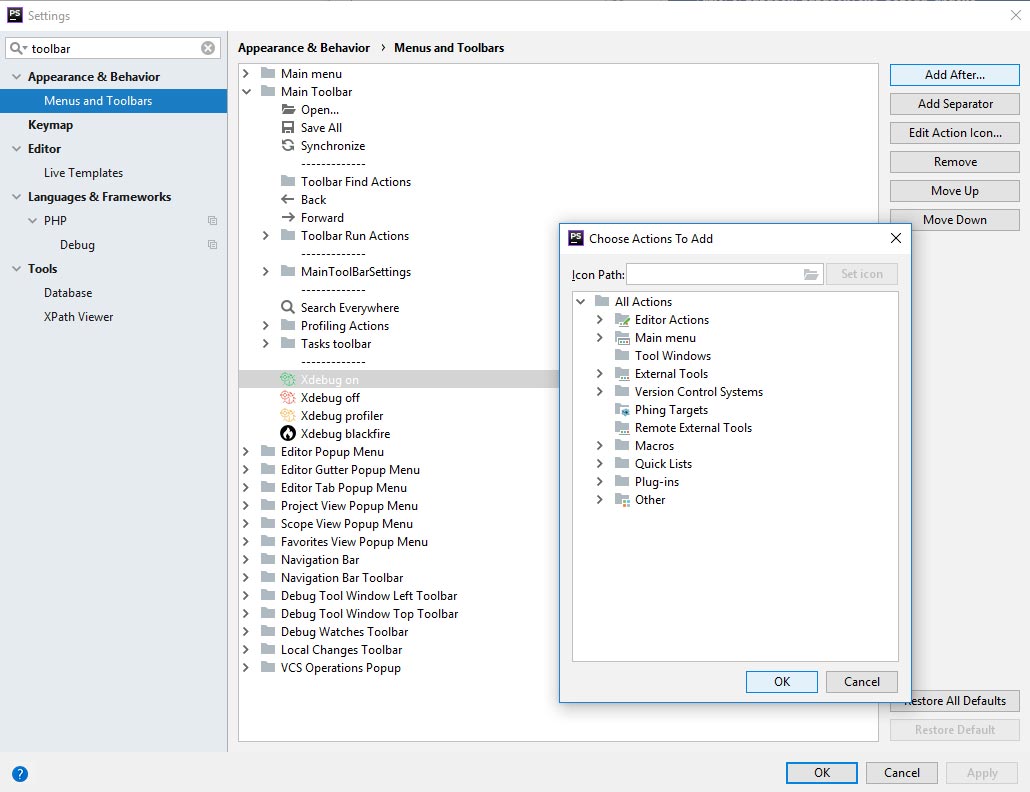
Save your work. Now new commands are available from PhpStorm menu Tools > External Tools, and it is time to add buttons to the PhpStorm toobar. Open Settings (Ctrl+Alt+S), find Appearance & Behavior > Menus and Toolbars, and add several buttons, as shown below:

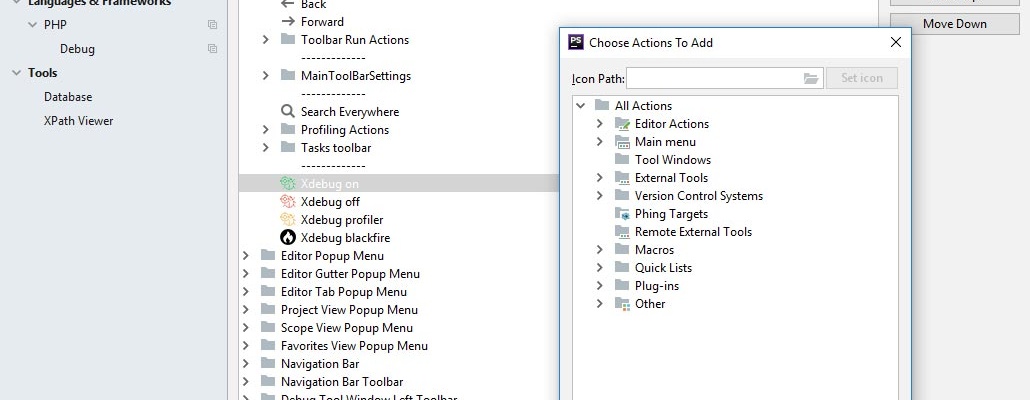
You can also add icons for your buttons (.png, 16 x 16). My icons are here:


That’s all. Just click on relevant button to switch debug and profiling mode in PhpStorm easily.


